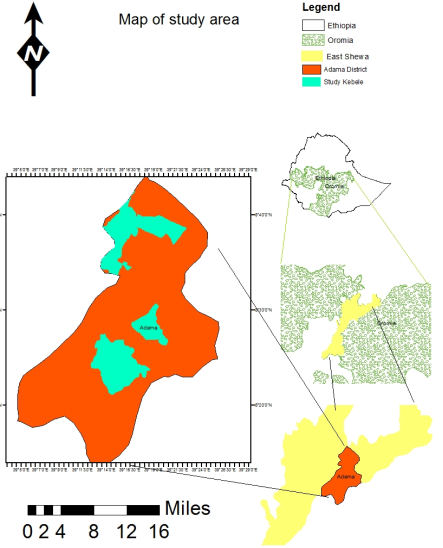
The study was conducted to evaluate the quality of honey produced in Adama District and Adama Town at different market points. Moreover, a total of 23 honey samples were collected from beekeepers and different market points and used for quality analyses. The ash content, free acidity, and pH values of all honey samples were found within the limits of the national standards. Except for the honey samples collected from on-street (24.62±0.67), minimarket (23.23±0.58), and retailer (22.60±0.58) the moisture contents of honey samples were within the national standards. The fructose and glucose contents of the samples were within the national standards, whereas none of the samples complied with the national sucrose content standard. High sucrose content was observed in the samples obtained from retailers (32.23±1.78%) and on-street (31.90±2.06%) market points. In general, the results of this study indicated that there is an overall honey quality problem in the sampled area. However, the level of the problem is more inclined towards the on-street and minimarket areas. Thus, honey market legislation is needed in the area in particular and in the country in general to protect honey consumers, producers, traders, and other stakeholders involved in the honey market value chain.
| Published in | Frontiers (Volume 5, Issue 2) |
| DOI | 10.11648/j.frontiers.20250502.11 |
| Page(s) | 62-71 |
| Creative Commons |
This is an Open Access article, distributed under the terms of the Creative Commons Attribution 4.0 International License (http://creativecommons.org/licenses/by/4.0/), which permits unrestricted use, distribution and reproduction in any medium or format, provided the original work is properly cited. |
| Copyright |
Copyright © The Author(s), 2025. Published by Science Publishing Group |
Adulteration, Adulterant, Market Point, Botanical Origin, Detection of Adulterations, Physicochemical, Quick Test
Treatment | Moisture content (gm/100gm) | Ash content (gm/100gm) | HMF (mg/kg) | pH value | Free acidity (meq/kg) |
|---|---|---|---|---|---|
T1 | 24.62±0.67c | 0.05±0.02a | 27.18±3.20a | 3.24±0.08ab | 23.47±2.33ab |
T2 | 22.60±0.58bc | 0.06±0.02ab | 29.09±2.78ab | 3.13±0.07a | 33.88±2.02c |
T3 | 23.23±0.58bc | 0.07±0.02ab | 35.14±2.78ab | 3.41±0.07abc | 27.84±2.02abc |
T4 | 21.05±0.58ab | 0.06±0.02ab | 39.39±2.78b | 3.50±0.07bc | 28.73±2.02bc |
T5 | 18.90±0.58a | 0.13±0.02b | 31.92±2.78ab | 3.57±0.07c | 20.03±202a |
T6 | 19.10±0.58a | 0.21±0.02c | 28.31±2.78ab | 3.67±0.07c | 25.88±2.02abc |
P-value | <0.000 | <0.000 | <0.000 | <0.028 | <0.000 |
Sugars | Treatment | P value | |||||
|---|---|---|---|---|---|---|---|
T1 | T2 | T3 | T4 | T5 | T6 | ||
Fructose | 37.47±1.12ab | 38.69±0.97b | 34.48±0.97a | 37.57±0.97a | 39.01±0.97b | 39.01±0.97b | <0.013 |
Glucose | 32.03±0.88b | 28.08±0.76a | 26.93±0.76a | 28.55±0.76a | 28.40±0.76a | 28.90±0.76ab | <0.003 |
Sucrose | 31.90±2.06c | 32.23±1.78c | 20.79±0.76b | 21.37±1.78b | 9.89±1.78a | 8.60±1.78a | <0.000 |
ATVET | Agricultural Technical, Vocational, and Education Training |
CRD | Completely Randomized Design |
CSA | Central Statistical Agency |
EHC | European Honey Commission |
EU | European Union |
FAO | Food and Agricultural Organization |
GC | Gas Chromatography |
HBRC | Holeta Bee Research Center |
HMF | Hydroxy Methyl Furfural |
HPLC | High-Performance Liquid Chromatography |
Meqkg-1 | Milli Equivalent Per Kilogram |
MC | Moisture Content |
Mgml-1 | Milligram per Milliliter |
NIR | Near-Infrared Spectroscopy |
| [1] | Abdel-Aal, E. M., Ziena, H. M. & Youssef, M. M. (1993). Adulteration of honey with high fructose corn syrup: sucrose syrups: correlations with HPLC-RID results. Food Research International, 64, 634-646. |
| [2] | Addis, N. (2016). Honey Value Chain Analysis: Amhara in the Semen Shewa Zone of Ethiopia; The case of Basona Woreda. (MBA Thesis) Addis Ababa, Ethiopia. |
| [3] | Alemu, T., Seifu, E., & Bezabih, A. (2013). Physicochemical Properties of Honey Produced in Sekota District, Northern Ethiopia: International Food Research Journal, 20(6), 3061-3067. |
| [4] | Aljohar, H. I., Maher, H. M., Albaqami, J., Al-Mehaizie, M., Orfali, R., Orfali, R., & Alrubia, S. (2018). Physical and chemical screening of honey samples available in the Saudi market: An important aspect in the authentication process and quality assessment: Saudi Pharmaceutical Journal, 26(7), 932-942. |
| [5] | Aloisi, F., Serafini, B., Magliozzi, R., Howell, O. W., & Reynolds, R. (2010). Detection of Epstein-Barr virus and B-cell follicles in the multiple sclerosis brain, 133(12), e157-e157. |
| [6] | Alvarez-Suarez, J. M., Tulipani, S., Romandini, S., Bertoli, E. & Battino, M. (2010). Contribution of honey to nutrition and human health: a review. Mediterranean Journal of Nutrition and Metabolism, 3(1), 15-23. |
| [7] | Amir, R. M., Anjum, F. M., Khan, MI, Khan, MR, Pasha, I. & Nadeem, M. (2013). Application of Fourier transform infrared spectroscopy (FTIR) to identify wheat cultivars. Journal of Food Science and Technology, 50(5), 1018-1023. |
| [8] | Amir Y, Yesli A, Bengana M, Sadoudi R & Amrouche T (2010). Physico-chemical and microbiological evaluation of honey from Algeria. Electronic Journal of Environmental, Agricultural & Food Chemistry, 9(9). |
| [9] | Belay, A., Haki, G. D., Birringer, M., Brock, H., Chul, Y., Cho, C.-W., (2016). Sugar Profile and Physicochemical Properties of Ethiopian Monofloral Honey: International Journal of Food Properties, 2912(November), 133. |
| [10] | Biluca, F. C., Braghini, F., Gonzaga, L. V., Costa, A. C. O. & Fett, R. (2017). Physicochemical profiles, minerals and bioactive compounds of stingless bee (Meliponinae) honey: Journal of Food Composition and Analysis, 50, 61-69. |
| [11] | Bogdanov, S., and Martin, P. (2003), the authenticity of the honey: Food Inspection and Hygiene Notices, 93(3): 232-254. |
| [12] | Bogdanov, S. (2009). Composition of honey. Book of Honey, Chapter 5. Bee Products Science, International Honey Commission, accessed 29 August 2012. |
| [13] | Chen, L., Xue, X., Ye, Z., Zhou, J., Chen, F., and Zhao, J. (2011). Determination of Chinese honey adulterated with fructose corn syrup by near-infrared spectroscopy: Food Chemistry, 128(4): 1110-1114. |
| [14] | Codex, A., and Intergovernmental, T. F. O. (2001). 24th Session of the Codex Alimentarius Commission of the Joint FAO/WHO Food Standards Programme, Geneva, 2-7 July 2001 Codex. |
| [15] | Crane, E. and Visscher, P. K. (2009). Hunaya Encyclopedia of Insects (459-461): Academic Journalism. |
| [16] | Crane E (1990). A book full of honey. International Bee Research Association, Oxford University Press, UK. |
| [17] | CSA (Centre for Statistics), (2020/21). Agricultural Selection Study of Cattle and Livestock Traits: Vol. (II), No. 581, March 2021, Addis Ababa. |
| [18] | Da Silva P M, Gauche C, Gonzaga L V, Costa AC O, & Fett R (2016). Honey: chemical composition, stability, and authenticity: Food Chemistry, 196, 309-323. |
| [19] | Ethiopia Standard Authority, (2005). Honey Specification: Ethiopian Standard, ES 1202: 2005. In: Addis Ababa, Ethiopia. |
| [20] | EU Council. (2002). Council Directive 2001/11 O/EC of December 20, 2001, on honey: Official Journal of the European Communities. |
| [21] | Fikru, S., Gebresilassie, G., & Kassa, A. (2015). Assessment of beekeeping practices (absconding, bee forage, and bee diseases and pests) in Jigjiga zone, Somali regional state of Ethiopia: Poultry, Fisheries & Wildlife Sciences. |
| [22] | Finola, M. S., Lasagno, M. C., & Marioli, J. M. (2007). Microbiological and chemical Characterization of honey from central Argentina: Food Chemistry, 100(4), 1649-1653. |
| [23] | Fredrick, N.; Anam, O.; Antony, G. and Elijah, N. (2013): Food Sci. Qua. Man., 12: 30-36. |
| [24] | Gebreegziabher Gebremedhin, Gebrehiwot Tadesse, and Etsay Kebede. (2014). Physiochemical Properties of Honey Produced from Traditional and Modern Beehive Production Systems in the Tigray Region of Northern Ethiopia: Momona Ethiopian Journal of Science (MEJS), 5(1), 115 128. |
| [25] | Gebremariam, T., & Brhane, G. (2014). Determination of Quality and Adulteration Effects of Honey from Adigrat And its Surrounding Areas: International journal of technology enhancements and emerging engineering research, 2, 71. |
| [26] | Gebru, Y. G. (2015). Characterization of beekeeping systems and the honey value chain, and effects of storage containers and durations on the physicochemical properties of 120 kinds of honey in Kiltie Awlaelo District, East Tigray, Ethiopia. PhD Dissertation, Department of Animal Production Studies. |
| [27] | Getu, A., and Birhan, M. (2014) Chemical analysis of honey and major challenges of honey production in and around Gondar: Ethiopia Academic Journal of Nutrition, 3(1): 06-14. |
| [28] | Hana’a, Y. A. E. H. (2007). Physicochemical Properties of Honey from different floral sources. A dissertation of the Degree of Master of Science in Food Science and Technology Agriculture University of Khartoum. |
| [29] | Iftikhar, F., Mahmood, R., Islam, N., Sarwar, G., Masood, M. A., & Shafiq, H. (2014). Physicochemical analysis of honey samples collected from local markets in Rawalpindi and Islamabad: Pakistan, American Journal of Biochemistry, 4(2), 35-40. |
| [30] | Islam, M. R., Pervin, T., Hossain, H., Saha, B., & Hossain, S. J. (2017). Physicochemical and antioxidant properties of honey from the Sundarbans mangrove forest of Bangladesh. Preventive Nutrition and Food Science, 22(4), 335. |
| [31] | Jeanne, F. (2005). Le miel: éléments d’analyse: Bulletin Technique Apicole, 32, 69-76. |
| [32] | Kayode, J., & Oyeyemi, S. D. (2014). Physicochemical Investigation of Honey Samples from Bee Farmers in Ekiti State, Southwest Nigeria: Journal of Plant Sciences, 2(5), 246-249. |
| [33] | Kinati, C., Tolemariam, T., and Debele, K. (2011). Evaluation of the quality of honey produced in Gomma Woreda, Southwest Ethiopia: Rural Development Livestock Research, 23(9): 6-14. |
| [34] | Kirko, V., Kononova, E., Lukyanova, A., & Razumovskaya, V. (2020). Education as an instrument of human capital development. In Edulearn20 Proceedings (pp. 8765-8770). Iated. |
| [35] | Kelly, J. D., Downey, G., & Fouratier, V. (2004). An initial study of honey adulteration by sugar solutions using midinfrared (MIR) spectroscopy and chemometrics: Journal of agricultural and food chemistry, 52(1), 33-39. |
| [36] | Krell, R. (1996). Value-added Products from Beekeeping. FAO Agricultural Services Bulletin No. 124, Rome. |
| [37] | Kucuk M, Kolayli S, Karaoglu S, Ulusoy E, Baltaci C & Candan F (2007). Biological activities and chemical composition of three kinds of honey of different species from Anatolia: Food Chemistry, 100(2), 526-534. |
| [38] | Kugonza, D. R., and Nabakabya, D. (2008). Processing and distribution channels affect the quality of honey in Uganda: Tropicultura, 26(2): 113-118. |
| [39] | Louveaux J, Maurizio A and Vorwohl G (1985) Methods of Melissopalynology, Bee World 59, 139157. |
| [40] | Makarewicz, M., Kowalski, S., Lukasiewicz, M., & Małysa-Paśko, M. (2017). Antimicrobial and antioxidant properties of some commercial honey available on the Polish market: Czech Journal of Food Sciences, 35(5), 401-406. |
| [41] | Marchini, J., Howie, B., Myers, S., McVean, G., & Donnelly, P. (2007). An adulteration and improper storage association. Nature Genetics, 39(7), 906-913. |
| [42] | Mohammed, SA (2014). Commercial Sudanese Honey: National Research Center. Faculty of Agricultural Sciences, University of Khartoum, Khartoum, Sudan. |
| [43] | Moniruzzaman, M., Sulaiman, S. A., Khalil, MI. & Gan, S. H. (2013). Evaluation of the physicochemical and antioxidant properties of sourwood and other Malaysian honey: a comparison with manuka honey: Chemistry Central Journal, 7(1), 138. |
| [44] | Muli, E., Munguti, A., and Raina, S. K. (2007) Quality of honey collected and processed using traditional methods in rural areas of Kenya: Acta Veterinaria Brno, 76(2): 315-320. |
| [45] | Muthui, B., N. (2012). Physiochemical properties of honey from Mwingi and selected urban areas in Kenya, effects of adulteration, and some levels of population awareness of honey adulteration. Master's thesis, Kenyatta University. |
| [46] | Nweze, J. A., Okafor, J. I., Nweze, EI. & Nweze, J. E. (2017). Evaluation of the physicochemical and antioxidant properties of two stingless bee honey: a comparison with Apis mellifera honey from Nsukka, Nigeria. BMC Research Notes, 10(1), 566. |
| [47] | Rybak-Chmielewska, H. (2007). Changes in the carbohydrate composition of honey undergoing during storage: Journal of Apicultural Science, 51(1), 39-47. |
| [48] | Sebeho, H. K. (2015). Honey production and quality characteristics in Ethiopia, review: Academic Journal of Entomology: Academic Journal of Entomology, 8(4), 168-173. |
| [49] | Silva, L. R., Videira, R., Monteiro, A. P., Valentão, P., & Andrade, P. B. (2009). Honey from Luso region (Portugal): Physicochemical characteristics and mineral contents: Microchemical Journal, 93(1), 73-77. |
| [50] | Teferi D. (2020). Quality assessment and failure detection using multiple analytical approaches using commercially available honey samples from Addis Ababa, Ethiopia: Addis Ababa University. |
| [51] | Terrab, Díez, M. J., and, C. Andrés. (2002). Physicochemical Parameters and Pollen Analysis of Moroccan Honeydew Honeys: International Journal of Food Science and Technology, 39: p. 167-176. |
| [52] | Tesfaye, B., Begna, D., and Eshetu, M. (2016). Evaluation of the physico-chemical characteristics of honey produced in Bale Natural Forest, Southeast Ethiopia: International Journal of Agricultural Science and Food Technology, 2(1), 21-27. |
| [53] | Visquert, M., Escriche, I., Andres, A., and Fito, P. (2004). Changes in honey quality parameters caused by thermal processes: Alimentacion-Equipos-y-Tecnologia, 23(188), 87-92. |
| [54] | Visquert, M., Vargas, M., and Escriche, I. (2014). Effect of post-harvest storage conditions on the color and freshness parameters of raw honey: International Journal of Food Science and Technology, 49(1): 181-187. |
| [55] | White, J. W. (1962). Composition of American honey: US Dept. of Agriculture. |
APA Style
Bekele, M., Mengistu, A., Ararso, Z. (2025). Evaluating Honey Quality at Different Market Points in Adama District and Adama Town, Oromia, Ethiopia. Frontiers, 5(2), 62-71. https://doi.org/10.11648/j.frontiers.20250502.11
ACS Style
Bekele, M.; Mengistu, A.; Ararso, Z. Evaluating Honey Quality at Different Market Points in Adama District and Adama Town, Oromia, Ethiopia. Frontiers. 2025, 5(2), 62-71. doi: 10.11648/j.frontiers.20250502.11
@article{10.11648/j.frontiers.20250502.11,
  author = {Melaku Bekele and Ashenafi Mengistu and Zewdu Ararso},
  title = {Evaluating Honey Quality at Different Market Points in Adama District and Adama Town, Oromia, Ethiopia
},
  journal = {Frontiers},
  volume = {5},
  number = {2},
  pages = {62-71},
  doi = {10.11648/j.frontiers.20250502.11},
  url = {https://doi.org/10.11648/j.frontiers.20250502.11},
  eprint = {https://article.sciencepublishinggroup.com/pdf/10.11648.j.frontiers.20250502.11},
  abstract = {The study was conducted to evaluate the quality of honey produced in Adama District and Adama Town at different market points. Moreover, a total of 23 honey samples were collected from beekeepers and different market points and used for quality analyses. The ash content, free acidity, and pH values of all honey samples were found within the limits of the national standards. Except for the honey samples collected from on-street (24.62±0.67), minimarket (23.23±0.58), and retailer (22.60±0.58) the moisture contents of honey samples were within the national standards. The fructose and glucose contents of the samples were within the national standards, whereas none of the samples complied with the national sucrose content standard. High sucrose content was observed in the samples obtained from retailers (32.23±1.78%) and on-street (31.90±2.06%) market points. In general, the results of this study indicated that there is an overall honey quality problem in the sampled area. However, the level of the problem is more inclined towards the on-street and minimarket areas. Thus, honey market legislation is needed in the area in particular and in the country in general to protect honey consumers, producers, traders, and other stakeholders involved in the honey market value chain.
},
 year = {2025}
}
TY  - JOUR
T1  - Evaluating Honey Quality at Different Market Points in Adama District and Adama Town, Oromia, Ethiopia

AU  - Melaku Bekele
AU  - Ashenafi Mengistu
AU  - Zewdu Ararso
Y1  - 2025/06/30
PY  - 2025
N1  - https://doi.org/10.11648/j.frontiers.20250502.11
DO  - 10.11648/j.frontiers.20250502.11
T2  - Frontiers
JF  - Frontiers
JO  - Frontiers
SP  - 62
EP  - 71
PB  - Science Publishing Group
SN  - 2994-7197
UR  - https://doi.org/10.11648/j.frontiers.20250502.11
AB  - The study was conducted to evaluate the quality of honey produced in Adama District and Adama Town at different market points. Moreover, a total of 23 honey samples were collected from beekeepers and different market points and used for quality analyses. The ash content, free acidity, and pH values of all honey samples were found within the limits of the national standards. Except for the honey samples collected from on-street (24.62±0.67), minimarket (23.23±0.58), and retailer (22.60±0.58) the moisture contents of honey samples were within the national standards. The fructose and glucose contents of the samples were within the national standards, whereas none of the samples complied with the national sucrose content standard. High sucrose content was observed in the samples obtained from retailers (32.23±1.78%) and on-street (31.90±2.06%) market points. In general, the results of this study indicated that there is an overall honey quality problem in the sampled area. However, the level of the problem is more inclined towards the on-street and minimarket areas. Thus, honey market legislation is needed in the area in particular and in the country in general to protect honey consumers, producers, traders, and other stakeholders involved in the honey market value chain.

VL  - 5
IS  - 2
ER  -
Holeta Bee Research Center, Oromia Agricultural Research Institute, Holeta, Ethiopia
Department of Animal Production Studies, Addis Ababa University, Bishoftu, Ethiopia
Holeta Bee Research Center, Oromia Agricultural Research Institute, Holeta, Ethiopia