Research Article | | Peer-Reviewed

Effect of Chomo Grass (Brachiariahumidicola) and Vetiver Grass (Vetiveriazizanioides) on Selected Soil Properties in Mana Sibu District, Western Ethiopia

Published in Frontiers (Volume 4, Issue 4)
Received: 8 November 2024     Accepted: 17 December 2024     Published: 30 December 2024
Views:       Downloads:
Abstract

Biological SWC practices of chomo grass, vetiver grass are the most productive, easy to accept and effective at reducing soil erosion and increasing soil organic matter. The objective of this research was to evaluate their effect on some selected soil physicochemical properties in Mana Sibu area. The land treated with chomo grass, vetiver grass, and adjacent untreated lands, as well as the three age groups of these grasses, young (0-10), middle (10-20), and old (20-30) years were considered. A total of 27 soil samples were collected from the subsurface of 0–20 cm soil depth in a 'zigzag' design because of vetiver strips impractical for means. The gathered soil samples were evaluated using laboratory procedures, and the general linear model included a total of 8 variables. The dry sieving analysis was carried out to separate the soil aggregate stability. Chomo and vetiver grasses effect on soil physicochemical properties, the clay soil texture was statistically highly significant at p < 0.001 following the treatments and at p < 0.01 along with age categories, while silt was not significant. The highest mean value of clay (72.67%) in the chomo grass treatment and age category (73%). The soil aggregate stability was shown to have statistical significance at p< 0.01 in the soil dry aggregate stable size fractions of > 2 mm, 0.075-0.425 mm, and 0.075 mm. Results for SOC were statistically significant at p< 0.05, while TN was at p < 0.05, soil PH at P < 0.01, and CEC at p <0.01.

Published in Frontiers (Volume 4, Issue 4)
DOI 10.11648/j.frontiers.20240404.17
Page(s) 167-178
Creative Commons

This is an Open Access article, distributed under the terms of the Creative Commons Attribution 4.0 International License (http://creativecommons.org/licenses/by/4.0/), which permits unrestricted use, distribution and reproduction in any medium or format, provided the original work is properly cited.

Copyright

Copyright © The Author(s), 2024. Published by Science Publishing Group

Keywords

Age Category, Chomo Grass, Mana Sibu, Soilphysicochemical Properties, Vetiver Grass

1. Introduction
Land degradation is one of the most important worldwide concerns of the 21st century, posing a threat to environmental and long-term growth . Consequently, land degradation is an obstacle to sustainable development due to its impact on the environment, food security, agro-ecosystem service provision, and people’s livelihoods UNCCD . 55.6% of the land area in the world has been affected by soil degradation in the historic past, and the affected area has been vreported as being damaged by water erosion . In Ethiopia, soil erosion is estimated to affect more than half of the land, with 25% of it being severely eroded and 4% of it no longer being productive and the soil loss rate of the country ranges from 16 to 300 t/ha/yr . Because of soil erosion, the country loses 1% to 2% of its crop production each year, resulting in a loss of USD 1 billion . Therefore, the government of Ethiopia is devoting substantial amounts of resources towards strengthening the national research system, in which more emphasis is given to the development of agricultural technologies in general and integrated natural resource management of soil conservation and extension programs in particular . As a result of the forementioned efforts, the future of agriculture in Ethiopia largely depends on the country’s ability to generate and implement large-scale improved agricultural technologies that increase productivity and income .
Biological soil and water conservation practices are the most productive measures for conserving soil and water resources . These measures are cheap, easily accepted by farmers, and even effective in reducing soil erosion, while less attention was given until the beginning of the 2000s because of technical biasness towards physical soil and water conservation measures (Descheemaeker et al., 2006b). Biological SWC practices in Ethiopia are Enclosures , plantations , agroforestry , gully re-vegetation (Nyssen et al., 2009a), and soil fertility-enhancing plantations . Vegetation is a sensitivity factor that affects soil erosion, and the use of vegetation mitigation measures is an effective way to control soil erosion caused by water . The ability of vegetation to prevent soil erosion is the combined effects of leaves, stems, roots, and litter that perform the function of soil and water conservation. In general, sheet and rill erosion are reduced by 50% when vegetation cover is around 20%, by 75% when vegetation cover is around 30–35%, and by 90% when vegetation cover is around 60% .
The soil physicochemical properties are influenced positively by SWC practices. Many scholars reported that the effects of SWC practices on the soil's physical properties by Terefe found that the clay concentrations were measured in treated cropland (36.33%), and grazing land (38.33%). Untreated land has a soil bulk density of 1.0242 gm/cm3 greater than treated fields at 0.9542 gm/cm3 in Diga district by Megersa . In the case of total porosity, Selassie et al. found that (63.47% and 66.98%) are under natural forests and (45.63 and 45.58%) are under cultivated land. Therefore, biological measures can speedily restore degraded land in terms of soil physical properties, improving soil fertility and nutrient status more than physical structures . Regarding soil chemical properties, total nitrogen (0.5% and 0.4%), soil pH (6.0% and 5.8%), soil organic matter (4.4% and 3.8%), and soil organic carbon (2.2% and 1.8%) were found under-treated and untreated farmland by .
Some authors have conducted their studies in different directions in Mana Sibu district on the chomo grass as to rehabilitate degraded land and manage termites ; degraded land rehabilitation role of chomo grass and its socioeconomic importance by ; the role of chomo grass and exclosures in restoring soil organic matter, total nitrogen, and associated functions in degraded lands by Damene et al. and much traditional land management, such as soil and water conservation practices, occurs in the fruitful scenario of Mana Sibu district . However, there is a research gap on chomo grasss morphological characteristics and its soil physicochemical properties under open land managed by chomo and vetiver grasses. In this study, it was examined how chomograss and its age category affected the morphological traits and selected soil physicochemical properties under open land with nearly similar natural factors. The native chomograss was chosen as a target plant because of its environmental importance in the study area.
2. Materials and Methods
2.1. Study Area
The location of Manasibu Woreda is lying between 9 º30'00"-10º00'00" North latitude and 34º50'00"- 35 º20'00"east longitudes (Figure 1). Population of Mana sibu woreda of 126,083 and the 15911 households, 64,399 were men and 61,684 were women; 14,008 or 11.11% of its population was urban dwellers whereas the major economic activity is Agriculture based on rain-fed. The study area has six land use/land covers which include arable lands (56%), grasslands (16%), settlement areas (14%), forest lands (6%), degraded lands (7%), and marshy areas (1%). The area is suitable for the cultivation of different annual and perennial crops. Hence, cereals (mainly maize, sorghum, barley, wheat, and teff), pulses (horse beans, field peas, and haricot beans), vegetables (tomato, cabbage, and onion), oil crops (Niger seed, and linseed), perennial fruits (mango, banana, avocado), root crops (potato, taro, yam, and sweet potato), and cash crops (coffee and spices) are the source of food and cash to the people. Perennial crops (coffee and fruits) accounted for 51% of the total area, followed by cereals (26%), oil crops (14%), pulses (5%), and vegetables and root crops (3.4%). The altitude of Manasibu Woreda ranges between 1145-1989 meters above sea level. The annual average temperature is 20.38°C whereas, the average low is 14.25°C and the Average high is 26.5°C. The total annual precipitation in the District is 1652 mm, and the average precipitation is 137.67 mm in the Woreda (MANO, 2021 unpublished).
Mana Sibu district has two agro-ecologic zones; Moist Woina Dega 89965.17 Ha (47.9%) and Moist kola 97677.29 Ha (52.1%) with the altitude range of 1500 -1989 and 1145-1500 asl respectively (Figure 2) according to MoA . The study area is characterized by undulating and rolling topography. The dominant slope gradient of the district ranges from 3 to 15% that covers 59% of the total area. Slope gradients ranging from 15 to 30% and 0 to 3% respectively cover around 18% and 13% of the total study area. However, steeper gradients of > 30% account for about 10% of the total area (MANO, 2021 unpublished).
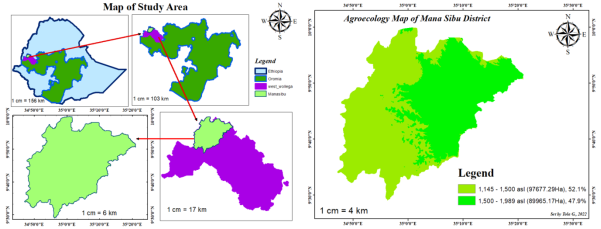
Figure 1. Map of Study Area and Agroecology map of Mana Sibu district.
2.2. Research Design and Methods
2.2.1. Experimental Design and Treatments
For study, Korke 02 kebele was purposively selected because of its well practices of biological SWC (Chomo, and Vetiver). For experimental implementation 27 samples' plots were selected whereas, 9 plots conserved with chomo grass, 9 plots with vetiver grass and and 9 plots control were without conservation practices. The experimental practice of two treatments which could be conducted as: chomo grass and vetiver grass with 3 age categories young (0–10 years), middle (10–20 years), and old (20–30 years) with 3 replication and control without any conservation practices corresponding to all the age category of treatments. The treatments would be arranged in a randomized complete block design where soil conservation practice (chomo grass) taken as the main plot.
2.2.2. Design for Soil Data Collection
The two practices (chomo grass vs. vetiver grass) and one control were used as treatments to study their effects on soil properties in the study area. On soil properties in Manasibu district korke 02 kebele, a divided plot design with chomo grass and vetiver grass biological soil and water conservation measures (chomo grass vs vetiver grass) was used. Thus, a total of twenty-seven (27) chomo grass, vetiver grass practices, and control (3 treatments x 3 age classes x 3 replications) were identified for soil properties in randomized complete block design (RCBD).
2.2.3. Research Methods and Procedures
This research was conducted in the Mana Sibu district. This area is known for Chomo grass development as alternative biological soil and water conservation. The study Woreda was purposely selected due to its chomo grass existence, growing experience, and wide coverage in the area. A purposive sampling technique was used to select a sample site to fit the aforementioned objectives of the study. The sample frame of the study was the chomo grass existence on conserved land as an alternative biological soil and water conservation practice in the three age classes for characterization. Personal observations were conducted to gather field data notes on the characteristics and management activities of individual farmers on their interest in the application of chomo grass as an indigenous soil conservation mechanism and its associated factors. These observed facts have been further investigated and consolidated with farmers who have implemented the chomo grass as an alternative biological soil and water conservation practice on their farmland and with farmers on their farmland by visualizing the practice. The practice was carried out on different issues of indigenous use of the chomo grass and vetiver grass biological soil conservation mechanism in the study area community.
2.2.4. Soil Sampling Methods and Procedures
Soil sample collection was carried out for each 10 m x10 m sample plot. During the sampling, five sampling points were set in each sample (Figure 5) to the "zig-zag" shape; a sampling design that is collected by traveling in a zig-zag pattern collecting from alternate corners of a plot. Then, the litter on the soil surface was removed, and the soil samples (disturbed and undisturbed) from the soil layer extending from 0–20 cm depth were collected using a sharp-edged and closed, circular auger pushed manually down the soil profile from the three age classes. The soil samples from five (5) sampling points were mixed into one (1) soil sample (there were nine (9) mixed soil samples for each treatment), which was put into the sampling box to avoid crushing and damaging the soil structure. A total of twenty-seven (27) mixed soil samples and undisturbed soil samples were taken with a core sampler of a height of 5 cm and a diameter of 5 cm for soil bulk density determination from selected sites as predesigned. Finally, the soil samples were sent to the soil and water laboratories at Asossa University College of Agriculture and Natural Resource Department of Soil Resource and Wa tershed Management and the soil laboratory at Jimma University College of Agriculture and Veterinary Medicine for investigation of soil physicochemical parameters.
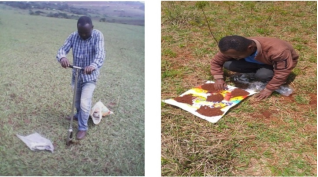
Figure 2. Soil sample collecting process.
2.2.5. Data Analysis Methods
(i). Laboratory Testing
The hydrometer method developed by Sakar and Haldar was used to determine the proportions of soil particle size. Following that, the equilateral triangle proposed by the United States Department of Agriculture (USDA) and described by Osman was used to determine soil texture and textural classification. A 1:2.5 soil to water ratio was used to assess soil response (soil pH) using a pH meter (Figure 6. The concentration of soil organic carbon (SOC) was evaluated using the Walkley and Black fast titration method published by Sakar and Haldar , The modified Kjeldahl methods, as modified by , were used to determine total nitrogen (TN).
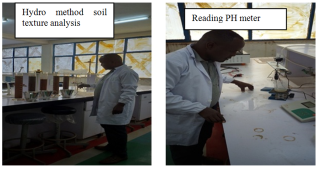
Figure 3. Soil Analysis Process in the Laboratory.
Soil bulk density was determined by the core method and quantified as the mass of the oven-dry soil (105◦C) divided by the core volume.
(1)
M is Mass of oven dried
V is core volume
Total porosity was calculated as London :
(2)
(ii). Soil Aggregate Stability Analyses
To obtain different size fractions of dry aggregates, five hundred grams (500 g) of fresh soils were placed on the top of a nested of sieves (2, 1, 0.6, 0.425, 0.212, 0.075 mm) and fractionated into four aggregate sizes. The sieve set was placed on the table stand firmily level surface. The dry sieving method was performed as described by Mendes et al . The fresh soil placed on the top of six sieves has rotated the sieve with one hand, gently tapping the side of the frame with the other hand, until most of the finer material has passed through into the pan. This typically took 1-4 minutes to complete. Soil recovered from each sieve was separately weighed for each sieve. Dry aggregate size distribution (ASD) was determined by the hand dry-sieving method. Briefly, 500 g of air-dried, undisturbed sample is sieved through a nest of sieves having 2, 1, 0.6, 0.425, 0.212, and 0.075 mm square openings so four aggregate size classes (ASCs) are obtained (>2, 0.425 -2, 0.075 - 0.425, and <0.075 mm). According to Kezdi , and Vandevelde, Percentage retained on any sieve was calculated as:
(3)
Whereas Cumulative percentage retained on any sieve was calcuted:
(4)
Percentage finer than any sieve size was estimated as:
(5)
Determination of effective size (D10), uniformity coefficient (CU), and coefficient of gradation (CC) was done from the particle-size distribution curves were used for comparing different soils. Also, three basic soil parameters were determined from these curves. The determined those parameters were effective size, uniformity coefficient and coefficient of gradation. The uniformity coefficient is given by the relation Bowles,
(6)
Where D10 is the diameter in the particle-size distribution curve corresponding to 10% finer is defined as the effective size. Cu is the uniformity coefficient and D60 is the diameter corresponding to 60% finer in the particle-size distribution. According to Olawuyi and Asante the coefficient of curvature was expressed as:
(7)
where Cc is the coefficient of gradation and D30 diameter corresponding to 30% finer.
Mean-weight diameter of dry aggregates was measured by using the weights of these ASCs, dMWD (mm) is calculated as Hillel :
(8)
where wi is the weight percentage of each ASC with respect to the total sample and xi is the mean diameter of each ASC (mm). Dry GMD (mm) is calculated as Hillel, calculated :
(9)
where wi is the weight percentage of each ASC with respect to the total sample and xi is the mean diameter of each ASC (mm). Aggregate size distribution, expressed as the structure coefficient (Ks), is calculated according to Shein et al. :
(10)
where “a” represents the weight percentage of aggregates 0.075-2 mm and “b” represents the weight percentage of aggregates <0.075 mm and >2 mm. however in case of this study analysis the sieve diameter used was 0.075-2 mm and 4.75 mm was as checker of the operation above 2 mm.
(iii). Statistical Analysis
Data analysis was carried out; by employing the two types of statistics. The descriptive data parts of the research were analyzed by using descriptive statistics such as mean and percentages. The inferential parts of the research were analyzed by using inferential statistics. The multivariate Analysis of Variance was used to test the differences in soil properties due to chomo grass, vetiver grass soil conservation practices, and control followed by the General Linear Model procedure at a P<0.05 level of significance. The LSD was used for the results showed significance for mean separation. The chomo and vetiver grasses and age were used as independent variables and the soil parameters were used as dependent variables. Pearson correlation analysis was performed for some selected soil properties to evaluate whether the soil parameters are associated with each other. Besides correlation, multivariate linear regression was done to measure the strength of relation and model fit. Statistical analyses were done with IBM SPSS Statistics version 20 and, MS-Excel was used to generate tables. The research model was set as:
(11)
Where yij = dependent variable (soil physicochemical properties), = sample mean, αi = chomo and vetiver grasses, βj = chomo and vetiver grasses ages, (αβ)ij = interaction between, chomo and vetiver grasses, and their ages, and εij = random error
3. Result and Discussion
3.1. Selected Soil Physical Properties Influenced by Chomo and Vetiver Grasses
Soil particle fractions: Soil particle fractions showed a statistically significant difference (p < 0.05) with a higher percentage of clay content in the chomo grass plot. The clay was statistically highly significant at p < 0.001. Silt and total porosity of soil properties are significant at p 0.001, whereas sand and BD are significant at p < 0.01 and p < 0.001. After analysis of variance was showed significant the LSD test carried out for soil physical properties (LSD=8.787). This was showed that the mean difference between BD vs (silt 13.98, sand 14.16, TP 41.1, and clay 68.72), silt vs TP (27.12 and clay 54.74), sand vs TP (26.94 and clay 54.56), and TP vs clay (26.63) in all treatments were significant. The mean particle size proportion showed that the soil was fine-textured in the chomo and vetiver grass plots, with a significant difference from the control plot. The soil in the study area has been dominated by clay content, experiencing a mean value of 72.67, 72.11%, and 64.56%, in chomo grass, vetiver grass, and control plots, respectively (Table 1), which implies that the mean value of clay content was higher under chomo grass conserved plots. This result is in agreement with (Belayne et al., 2019), who reported that the clay content experienced a mean value of 67.8% in conserved soil and non-conserved soil at 60.5% in the Gumara watershed. Under the vetiver grass, the highest mean sand component (16.11%) was found. Because soil texture is not modified by conservation techniques over such a short period, the variance in sand content could be attributed to inherent soil properties derived from the parent material. The higher the mean sand content, the vetiver grass was most probably remaining to eroded soil deposition under the strip slope gradient erosion control effect of the grass and coarse materials left by stiff roots, which may have increased the sand content under the vetiver grass. This result is consistent with Selassie et al., that found sand percentage (18%) contents in the Grazing lands of the Zikre Watershed, North-Western Ethiopia. However, the high mean value of silt was recorded in the control plots (Table 3). This result is consistent with the higher average value of silt (37.67%) that was recorded in the untreated land (Terefe, ).
Bulk density: This study result revealed that the variation in bulk density was statistically significant following treatments at p < 0.05 (Table 1). The investigation revealed that the highest mean value of bulk density was observed in the control (1.18 gm/cm3). However, there were lower mean values in the vetiver grass treatment (0.98 g/cm3). A comparatively higher bulk density in control plots could be related to the washing out of fine organic matter-rich soils by erosion and thereby exposing slightly heavier soil particulates. The findings of this study agree with that of Megersa , who found that untreated areas have a higher soil bulk density (1.0242 gm/cm3) than treated fields (0.9542 gm/cm3). In terms of age classes, the statistical analysis of bulk density revealed non-significance at p < 0.05 under the age class of the treatment. The old-age chomo grass plot had a higher mean value of 1.12 g/cm3, while the young-age vetiver grass had a higher mean value of 1.08 g/cm3. The higher mean values were clearly related to the compact effect of old age chomo grass and the high nutrient absorption of young age vetiver grass, as well as the freshly appeared grass's reduced ability to protect itself from erosion. This result is in line with that of Selassie et al. , who reported that the lowest bulk density values were found (1.05 t/m3) in natural forests and the greatest (1.33 t/m3) in grazing land.
Total porosity: The soil pore space content analyses of variance were statistically significant following the treatments at p < 0.05 (Table 3). However, there was a statistically non-significant result observed between age groups. However, the highest mean values were observed in the middle (10–20) vetiver grass (57.33%), which was greater than the highest mean values of the chomo grass plot (43.27%) in the same age group. Then, just like with vetiver grass, the percentage of total porosity is high; in the case of chomo grass, it also rises. This could be owing to a large amount of sand in the soil and the ability of the chomo and vetiver grass treatments to restore organic matter content, both of which have substantial consequences for increasing pore space in the soil. However, the lowest mean values were recorded in the control plot (29.58%) (Table 4). The findings are consistent with those of Selassie et al. , who found that the highest TP values were found under natural forests (66.98%), and the lowest values were found under cultivated land (45.58%).
Table 1. The overall mean of selected soil physical properties influenced by treatments.

Treatments

Soil physical properties

Sand (%)

Clay (%)

Silt (%)

BD (g/cm3)

TP (%)

Vetiver grass

16.11a

72.11a

12.11b

.98b

55.02a

Chomo grass

15.89a

72.67a

11.22b

1.01ab

41.88b

Control

13.67b

64.56b

21.78a

1.18a

29.58c

MSE

±0.45

±0.44

±0.471

±0.034

±3.819

p. value

0.000

0.000

0.000

0.014

0.025

R2

0.745

0.928

0.948

0.606

0.572

Note: BD =>Bulk Density, TP => Total Porosity
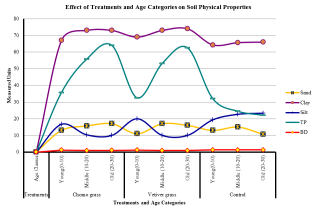
Figure 4. Treatments and age categories effect on soil physical properties.
Soil dry aggregate stable influenced by chomo and vetiver grasses: Table 2 shows the soil dry aggregate stability (DAS) in chomo and vetiver grassland management with neighboring control using the dry sieving method. The study results reveal that treatment types have a highly significant (p < 0.01) effect on each dry aggregate stable size class. Only the 0.075 mm aggregate stable had a significant treatment and its interaction with soil aggregate size class at p <0.05 where the aggregate size classes of 2–0.425 mm and 0.425–0.075 mm were statistically significant In both types of grass from the six distinct age groups and one control, the > 2 mm and 0.425–2 mm fractions were the most common (Table 2). Figure 5 below shows, that the content of >2 mm fractions accounted for 17.69%, while the percentage of 0.425–2 mm fractions ranged from 32.54 to 39.57, with the highest mean observed in the vetiver grass plot, while 0.075 mm- 0.425 mm, the mean percentage ranges from 39.93 to 47.65, with the highest mean observed in the control plot, and in the < 0.075 mm, the mean percentage ranged from 4.36 to 9.79, with the highest mean observed in the control plot. In vetiver grass, the largest percentage was found in the 0.075-0.425 mm diameter range (40.18%), whereas the other diameter percentages for >2 mm, and <0.075 mm were 20.37, and 3.69%, respectively. This study results in line with Igwe and Nwokocha that found the dry stable aggregate sizes of >2 mm ranged from 11.88 to 22.18%, while the 2-1 mm sizes were between 13.03 and 23.03%. And also (Zhao et al., 2017) found that the types of land use contributed to soil aggregate variation, implying that land use was the most important factor determining soil aggregate stability and size distribution. The percentage of soil dry aggregate stable fractions in diameters of > 2 mm, 0.075-0.425 mm, and 0.075 mm in all age classes of the treatments indicated a significant difference in diameters of > 2 mm, 0.075-0.425 mm, and 0.075 mm. The soil diameters of 0.425-2 mm, on the other hand, had little bearing on the soil aggregate size distributions. As a result, with the dry sieving procedure, the percentages of 2 mm fractions were chomo grass > vetiver grass > control. However, in the range of 0.075–0.425 mm, the vetiver grass comes first, followed by chomo grass, and then control. Unlike the control plot, the first, chomo grass and vetiver grass were similar in the soil particle fractions of 0.075 mm, hence, control > vetiver grass = chomo grass. This reveals that both chomo and vetiver grasses aggregate soil particles more than neighboring non-treated land, implying that these two types of grass contribute to soils with high organic matter content. The amount of organic matter in the environment increases collective stability. This finding in agreement with that of Gyssels et al. , who found a positive association between fine roots and soil aggregate stability, suggesting that plant roots may be another element in soil aggregate development and stabilization. Besides, these findings are consistent with Dorji's findings that soil organic matter plays a role in the stability and distribution of soil aggregates. The control plot had limited soil aggregation, resulting in small particles of clay that are vulnerable to various types of erosion agents, as seen in the last order. Vanek et al. found a similar finding, stating that clay-rich soils are deemed "fine-textured" and can cause compaction and drainage issues. The results of this investigation revealed that the two main treatments (Chomo and Vetiver grasses) have nearly similar effects on soil dry aggregate stability (Figure 5). The soil particle size distribution curve overlapped at many spots in this case. This suggests that both types of grass have similar soil aggregation conditions. Because vetiver grass is an internationally recognized biological SWC measure, the chomo grass exhibits a high degree of similarity in drastically recovering and conserving degraded land in this research area. In the case of chomo grass, the effective size (D10) was calculated to be 0.3131 from the semi-log graph. D30 and D60, on the other hand, were 0.8299 and 0.8762, respectively (Figure 6). From the particle-size distribution curves, the uniformity coefficient (Cu) and the coefficient of gradation (Cc) were found to be 8.033 and 0.2462, respectively. These curves were also used to determine three basic soil characteristics. However, vetiver grass plot dry sieving showed the significance of the effective size (D10) was discovered to be 0.0942, whereas D30 and D60 were 0.234 and 0.768, respectively. The uniformity coefficient (Cu) was calculated to be 8.153 and the coefficient of gradation (Cc) to be 0.0067. In the instance of the control plot, the D10 (effective size) observed was 0.0838, whereas the D30 and D60 were recorded as 0.1417 and 0.501 in that order. The control plot uniformity coefficient (Cu) was calculated to be 5.973, while the coefficient of gradation (Cc) was calculated as 0.00336 from the semi-log graph using micro-soft excel (Figure 5). However, based on the rates of Zhou , this result showed that gap graded soil because, Cc is not between 1 and 3.
In this study, the mean weight diameter of chomo grass and vetiver grass in the examined soils yielded the best results. While dry, MWD grew much more in chomo grass (1.06 mm) tested soil than in Vetiver grass (1.02 mm) and control plots (0.87 mm) soil (Table 3). This result is in line with Igwe and Nwokocha , who found that the MWD for the dry aggregate stable was from 0.88 to 1.87 mm. By having the highest mean weight diameter in soil dry aggregate stable, the Chomo grass has a great impact on the soil particle dry stable aggregate (DSA) size distribution. The Chomo grass plot soils had a greater geometric mean diameter of dry sieved aggregates (GMD) than the Vetiver plot soils.
Table 2. Mean soil dry aggregates stability by dry sieving method in different treatments.

Treatments

Soil aggregate stability (%)

> 2 mm

0.425-2 mm

0.075-0.425 mm

< 0.075 mm

Chomo grass

17.69a

43.11a

36.67b

5.8b

Vetiver grass

15.07b

39.23ab

38.92b

4.36b

Control

9.58c

35.54b

44.99a

10.12a

P. Value

0.002

0.043

0.007

0.007

Table 3. MWD, GMD and Ks in Soil Particle Aggregate Stability.

Treatments

MWD (mm)

Ks

GMD (mm)

Chomo grass

1.06

1.12

0.595

Vetiver grass

1.02

1.24

0.299

Control

0.87

0.91

0.303

MWD=mean weight diameter, GMD =geometric mean diameter and Ks=coffiecient of soil structure
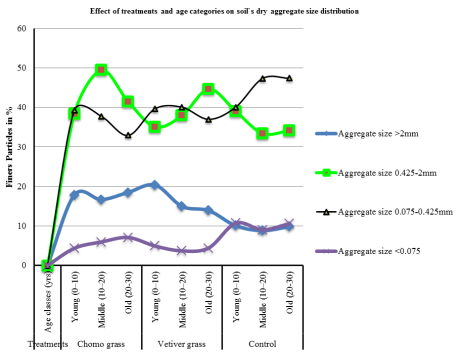
Figure 5. Treatments and age categories on soil`s dry aggregate stable sizes.
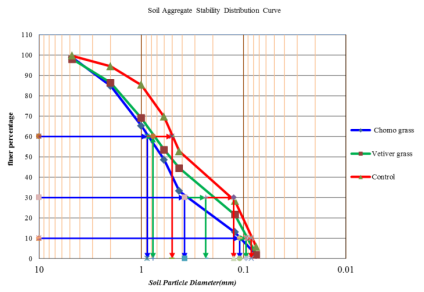
Figure 6. Soil dry stable aggregate size distributions curve (%).
3.2. Selected Soil Chemical Properties Effected by Chomo and Vetiver Grasses
The soil organic carbon (SOC): The analysis of variance results for SOC showed a statistically significant mean difference following treatments at p < 0.05 (Table 4). The mean values of the organic carbon content of the soil in the vetiver grass conserved plots were higher (14.22%) than in the chomo grass plots (13.3). The smallest mean values were observed in the non-conserved control plots (8.18%). The order is vetiver grass plot > chomo grass plot > control plot. This could be because vetiver grass with age variation reduces surface runoff and soil erosion, which boosts biomass development and adds to soil organic carbon input. It could also be linked to increased biomass production and reduced degradation in the protected vetiver and chomo grass plots of land. This study's finding is in agreement with Damene et al. finding that soil organic carbon is much greater in wood/bushland soils than in chomo grasslands and bare land soils, in the order wood/bushland > grassland > bare land. There was no significant mean variation across vetiver and chomo grass age classes. From youngest to oldest age, the mean variation in chomo grass was (2.9%) and in vetiver grass was (0.5%). Comparatively, the lowest mean values were recorded in the control plot age group for both soil parameters. For all age classes of the treatments, there was no significant difference in soil organic carbon. This result is in line with Damene et al. , who reported a consistent result, that the difference in soil organic carbon accumulation between grassland exclosures and bare land was 0.23%. Gupta, also reported that by agroforestry system enhancement, the soil nutrient was 33–83% organic carbon for restoring and increasing land productivity.
3.2.1. Total Nitrogen
The total nitrogen (TN) content of the soil was statistically significantly affected by chomo grass as an alternative biological SWC practice at p< 0.05 (Table 4). According to Landon found that the TN content of the soil in the Mana Sibu district was rated high and medium in vetiver and chomo grass conserved plots and non-conserved control plots, respectively. The mean total nitrogen of the soil was greater in vetiver and chomo grasses conserved (1.21 and 1.11%) than in non-conserved control plots (0.73%). This result is consistent with Gadisa and Hailu's findings of increased total nitrogen between conserved (0.15%) and non-conserved farmlands (0.101%). In terms of age classes, the TN was statistically non-significant at p < 0.05. However, the highest mean values were observed in the chomo grass age classes of 0–10 (1.22%) and the lowest was at age 10–20 (0.98%). While the vetiver grass plot showed a significant mean difference between young (1.23%) and old (1.17%) ages. For both chomo and vetiver grasses, treatments, and age classes, the total nitrogen revealed significant maximum mean values in the age classes, while in the control treatment and age classes it showed a minimum to medium range in all cases.
3.2.2. PH of the Soil
The acidity level of the Mana Sibu district in general was rated as medium acidic based on Osman's acidity and alkalinity categories of soil pH. This study result of soil PH showed that the treatments were statistically significantly different at P < 0.01. The mean pH values of the soil in the study area for the three treatments were 5.03, 5.12, and 4.32 in the chomo grass, vetiver grass, and non-conserved control plots, respectively (Table 4). The acidity of the soil could be related to the sub-humid nature of the area and the high amount of rainfall. It is true that greater rainfall increases soil acidity, and humid areas are more acidic than arid and semi-arid areas . Concerning the age groups, the mean values of pH in the study area of all the locations ranged from the young age of chomo grass (4.83 to 5.30), vetiver grass (4.87 to 5.23), and control plot (4.30 to 4.37). This finding is consistent with the findings of Damene et al. , who found that the soil pH ranges from the lowest in bare lands (5.04) to the highest in wood/bushland (5.35) soils in the Mana Sibu District, and Selassie et al., found that the soil pH range from non-managed plots has a lower pH value (5.44) than other land treatments (6.05) in the Zikre watershed. Though soil pH is mainly determined by parent materials, it is also influenced by land cover types in the long run. The small pH reflected in the young age of vetiver grass might be related to high rainfall, associated with leaching and removal of important soil nutrients due to the newly emerged vetiver grass's ability to recover from soil erosion.
3.2.3. Capacity for Cation Exchange
The cation exchange capacity (CEC) showed statistical significance at p<0.01. According to the rating standards of Landon , the cation exchange capacity (CEC) of the soil in the Mana Sibu area was rated as medium (17.44 to 24.78 meq/100gm) in all treatments. The study results revealed that chomo grass as an alternative biological SWC measure in the study area had a positive effect on the CEC content of the soil. The mean value was higher in chomo grass conserved plots (24.78 meq/100gm), followed by vetiver grass conserved plots (23.00 meq/100gm) and non-conserved control plots (17.44 meq/100gm) (Table 4). This is believed to be caused by the relative effect of chomo grass as an alternative biological conservation measure in the Mana Sibu district. This study's findings agree with Megersa's findings that CEC values were considerably different among land-use types, with natural forest (44.33 meq/100gm) and cultivated areas (41.95 meq/100gm) having the highest and lowest values, respectively. In like ways, Tesfay et al. reported that CEC values were greatest in natural forests (35.44 meq/100gm) and lowest in cultivated lands (26.08 meq/100gm). In terms of the age classes of the treatments, the CEC was shown to have statistical significance at p < 0.01 with the greatest mean value (25.33 meq/100gm and 25.00 meq/100gm) being observed in the middle and old age Chomo grass, respectively. Whereas the vetiver grass treatment had the highest mean value CEC of (25.00 meq/100gm) at a young age. In the same way, plots of middle and old-age vetiver grass had mean values of 22.33 meq/100 gm and 22.67 meq/100 gm, respectively. When determined using the USDA textural triangle, the soil in the Mana Sibu area is dominated by clay, and soils with a higher clay fraction are more likely to have a higher cation exchange capacity. The findings of this study agree with those of Tesfay et al. , who reported that the lowest (37.57 meq/100 gm) and maximum (56.78 meq/100 gm) CEC were found in the middle and young age exclosures in Ethiopia's central dry lowlands.
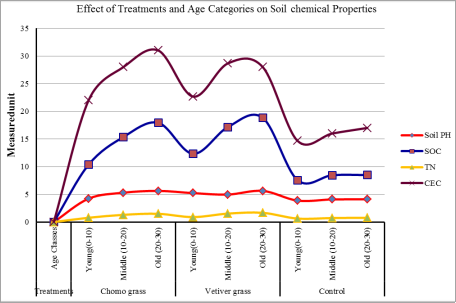
Figure 7. Effect of treatments and age categories on soil chemical properties.
Table 4. The Mean soil chemical properties influenced by treatments.

Treatments

PH

SOC

TN

CEC

Chomo grass

5.03

13.00

1.11

24.78

Vetiver grass

5.12

14.22

1.21

23.00

Control

4.32

8.18

.73

17.44

MSE

±0.20

±2.25

± 0.195

±1.33

P Value

0.001

0.014

0.031

0.001

R

0.829

0.7014

0.6656

0.8944

R2

0.688

0.492

0.443

0.800

Note: CEC= cation exchange capacity, SOC = Soil Organic Carbon, TN = Total Nitrogen
4. Conclusion
In the Mana Sibu district, land resources management by chomo and vetiver grasses have showed higher improvement in selected soil properties and ground cover intensity. Chomo grass and vetiver grass and their age category significantly influenced soil physicochemical properties in the study area. Chomo and vetiver grasses conserved land that has the highest clay content, TP, organic carbon, total nitrogen, and soil aggregate stability. However, soil bulk density and soil silt content were lowest in the chomo and vetiver grass-treated land. Therefore, chomo grass and vetiver grass could be an alternative measure to conserve soil and water that improve soil fertility and community livelihoods. Chomo grass is highly recommended for gully head rehabilitation due to its densely growing habit and high ground cover. It is also recommended for highly degraded and fragile soils, where other plants cannot well survive; because it is effective in enclosures and open areas by favoring the environment. It is preferable to scale up and expand chomo grass as an alternative biological SWC practice to non-practice areas, and Additional effectiveness research on chomo grass soil erosion control is required.
Abbreviations

SWC

Soil and Water Conservation

CEC

Cation Exchange Capacity

TN

Total Nitrogen

SOC

Soil Organic Carbon

Author Contributions
Tola Geleta Jawi is the sole author. The author read and approved the final manuscript.
Funding
No funding received for this research.
Data Availability Statement
The data that has been used is confidential.
Conflicts of Interest
The authors declare no conflicts of interest.
References
[1] Adie A, Duncan A., 2013. Chomo grass (Brachiariahumidicola) to rehabilitate degraded land manages termites. CGIAR Challenge program, Water and Food Nile.
[2] Blake, G. R., Hartge, K. H., 1986. Bulk density. In: Methods of Soil Analysis, Part 1 Physical and Mineralogical Methods, Klute A., (Ed.). American Society of Agronomy-Soil Science Society of America, Madison, WI, USA. pp. 363–375.
[3] CSA (Central Statistical Agency of Ethiopia (2008) Summary and statistical report of the 2007 population and housing census: population size by age and sex, Addis Ababa.
[4] Da Cunha, A. L., Zhou, J. and Do, M. N., 2006. The non-subsampled contour let transform: theory, design, and applications. IEEE transactions on image processing, 15(10), pp. 3089-3101.
[5] Damene, S., Bahir, A. and Villamor, G. B., 2020. The role of Chomo grass (Brachiaria humidicola) and exclosures in restoring soil organic matter, total nitrogen, and associated functions in degraded lands in Ethiopia. Regional Environmental Change, 20(3), pp. 1-13.
[6] Degife, A. W., Zabel, F. and Mauser, W., 2021. Climate change impacts on potential maize yields in Gambella Region, Ethiopia. Regional Environmental Change, 21(2), pp. 1-12.
[7] Descheemaeker, K., Muys, B., Nyssen, J., Poesen, J., Raes, D., Haile, M. and Deckers, J., 2006b. Litter production and organic matter accumulation in exclosures of the Tigray highlands, Ethiopia. Forest ecology and management, 233(1), pp. 21-35.
[8] Dorji T, Field DJ, Odeh IOA (2020) Soil aggregate stability and aggregate-associated organic carbon under different land use or land cover types. Soil UseManage 36, 308–319.
[9] Ebabu K, Tsnekawa A, Haregeweyn N, Adgo E, Meshesha DT, Aklog D, Masunaga T, Tsubo M, Sultan D, Fenta AA, Yibeltal M (2017) Analyzing the variability of sediment yield: a case study from paired watersheds in the upper Blue Nile basin, Ethiopia. Geomorphology 303: 446–455.
[10] Etefa DF. 2013. Environmental rehabilitation initiatives in Ethiopia: the necessity of environmental rehabilitation. LAMBERT Academic Publishing ISBN-10: 9783659322792.
[11] Evans, J. D., 1996. Straightforward statistics for the behavioral sciences. Thomson Brooks/Cole Publishing Co.
[12] F. Tesfay K. Kibret, A. Gebrekirstos, K. M. Hadigu, (2020). Changes in selected soil properties across a chronosequence of exclosures in the central dry lowlands of Ethiopia. Eurasian J Soil Sci 2020, 9(2) 173-185.
[13] Gadisa, S. and Hailu, L., 2020. Effect of level soil bund and fayna juu on soil physico-chemical properties, and farmers adoption towards the practice at Dale Wabera District, Western Ethiopia. American Journal of Environmental Protection, 9(5), pp. 107-20.
[14] Gebre, H., Kindie, T., Girma, M. and Belay, K., 2013. Trend and variability of rainfall in Tigray, northern Ethiopia: analysis of meteorological data and farmers' perception. Academia Journal of Agricultural Research, 1(6), pp. 088-100.
[15] Geleto, T. C. and Tulu, M. B., 2020. Degraded land rehabilitation role of chomo grass (Brachiariahumidicola) and its socio-economic importance; evidence from Western Ethiopia. J. Degrade. Min. Land Manage. 7(3): 2155-2162.
[16] Girmay, G., Singh, B. R., Nyssen, J. and Borrosen, T., 2009. Runoff and sediment-associated nutrient losses under different land uses in Tigray, Northern Ethiopia. Journal of hydrology, 376(1-2), pp. 70-80.
[17] Gyssels, G., Poesen, J., Bochet, E. and Li, Y., 2005. Impact of plant roots on the resistance of soils to erosion by water: a review. Progress in physical geography, 29(2), pp. 189-217.
[18] Haregeweyn, N., Tsunekawa, A., Nyssen, J., Poesen, J., Tsubo, M., Meshesha, D. T., Schutt, B., Adgo, E., Tegegne, F., 2015. Soil erosion and conservation in Ethiopia: a review. Prog. Phys. Geogr. 1–25.
[19] Hillel, D., 2004. Soil physics and soil physical characteristics. Introduction to environmental soil physics. Academic, New York, pp. 3-19.
[20] Hurni, H., Herweg, K., Portner, B. and Liniger, H., 2008. Soil erosion and conservation in global agriculture. In Land use and soil resources (pp. 41-71). Springer, Dordrecht.
[21] Igwe, C. A. and Nwokocha, D., 2005. Influence of soil properties on the aggregate stability of a highly degraded tropical soil in Eastern Nigeria. International agrophysics, 19(2).
[22] Jiru, E. B. and Wegari, H. T., 2022. Soil and water conservation practice effects on soil physicochemical properties and crop yield in Ethiopia: review and synthesis. Ecological Processes, 11(1), pp. 1-16.
[23] Kezdi, A. - "Handbook of Soil Mechanics", Vol. 2, Soil Testing, Elsevier Scientific Publishing Company, 258 p., 1980.
[24] Lanckriet, S., Araya, T., Cornelis, W., Verfaillie, E., Poesen, J., Govaerts, B., Nyssen, J., 2012. Impact of conservation agriculture on catchment runoff and soil loss under changing climate conditions in May Zeg-zeg (Ethiopia). J. Hydrol. 475, 336–349.
[25] Landon, J. R., 2014. Booker tropical soil manual: A handbook for soil survey and agricultural land evaluation in the tropics and subtropics. Routledge, New York, USA. 531p.
[26] Megersa, T., 2011. Assessing the role of traditional land management practices in improving cropland productivity: The case of DigaWoreda, Oromia (M.Sc. Thesis). Ambo, Ethiopia: Ambo University.
[27] Mendes, I. C., A. K. Mandick, R. P. Dick, and P. J. Bottomley. 1999. Microbial biomass and activities in soil aggregates affected by winter cover crops. Soil Sci. Soc. Am. J. 63: 873–881.
[28] Meseret, D., 2016. Land degradation in Amhara Region of Ethiopia: review on extent, impacts and rehabilitation practices. J. Environ. Earth Sci, 6(1), pp. 120-130.
[29] Muys, B., Nyssen, J., du Toit, B., Vidale, E., Prokofieva, I., Mavsar, R., Palahi, M., 2014. Water-related ecosystem services of forests: learning from regional cases. In: Forests under Pressure: Local Responses to Global Issues. International Union of Forest Research Organizations (IUFRO) World Series 32, 423–440, Vienna, Austria.
[30] Nyssen, J., Frankl, A., Zenebe, A., Deckers, J., Poesen, J., 2015. Land management in the northern Ethiopian highlands: local and global perspectives; past, present and future. Land Degrad. Dev. 26.
[31] Nyssen, J., Haile, M., Naudts, J., Munro, N., Poesen, J., Moeyersons, J., Frankl, A., Deckers, J., Pankhurst, R., 2009a. Desertification? Northern Ethiopia re-photographed after 140 years. Sci. Total Environ. 407(8), 2749–2755.
[32] Olawuyi, D., Alabi, O. J., Jiya, E., Egena, S. and Alemede, I., 2019. Dietary Protein Requirement For Growth Performance And Nutrient Digestibility Of Funaab Alpha Broiler Chickens.
[33] Osman KT (2013) Soils: principles, properties and management. Springer, Dordrecht.
[34] Sakar, D. and Haldar, A., 2005. Physical and chemical method in soil analysis: fundamental concepts of analytical chemistry and instrumental techniques. New Age International (P) Ltd Publisher, New Delhi.
[35] Selassie Y. G, F. Anemut and S. Addisu. 2015. The effects of land-use types, management practices, and slope classes on selected soil physicochemical properties in Zikre watershed, North-Western Ethiopia. Environmental Systems Research (2015) 4: 3.
[36] Shein, I. R., Medvedeva, N. I. and Ivanovskii, A. L., 2001. The band structures of superconducting MgB2 and the isostructural compounds CaGa2, AgB2, AuB2, ZrBe2, and HfBe2. Physics of the Solid State, 43(12), pp. 2213-2218.
[37] Sonneveld, B. G. J. S. and Keyzer, M. A., 2003. Land under pressure: soil conservation concerns and opportunities for Ethiopia. Land Degradation & Development, 14(1), pp. 5-23.
[38] Terefe H., M. Argaw, L. Tamene, K. Mekonnen, J. Recha and D. Solomon, 2020. Effects of sustainable land management interventions on selected soil properties in Geda watershed, central highlands of Ethiopia. Ecological Processes (2020) 9: 14.
[39] Terefe, T., 2011. Farmers' perception on the role of vetiver grass in SWC in Southwest Ethiopia: The Case of Tubule Peasant Association, Metu District (M. A. Thesis). New Delhi, India.
[40] Tolassa, T. B. and Jara, G. O., 2021. Factors affecting improved seed and soil conservation technology adoptions.
[41] UNCCD (2015) Combating desertification/land degradation and drought for poverty reduction and sustainable development: The contribution of science, technology, traditional knowledge and practices. Committee on Science and Technology Fourth special session, Cancun, Mexico, 9–12 March 2015.
[42] Vaezi, A. R., Ahmadi, M. and Cerdà, A., 2017. Contribution of raindrop impact to the change of soil physical properties and water erosion under semi-arid rainfalls. Science of the Total Environment, 583, pp. 382-392.
[43] Vandevelde, P. E. (2008), Structural Mechanics (Version Fall, 2008), GEM Engineering Inc. (pdf. accessed online on 10/9/2010 by 4. 49pm)
[44] Wang, J., Watts, D. B., Meng, Q., Zhang, Q., Wu, F. and Torbert, H. A., 2016. Soil water infiltration impacted by maize (Zea mays L.) growth on sloping agricultural land of the Loess Plateau. Journal of Soil and Water Conservation, 71(4), pp. 301-309.
[45] Wang, Y., Kala, M. P. and Jafar, T. H., 2020. Factors associated with psychological distress during the coronavirus disease 2019 (COVID-19) pandemic on the predominantly general population: A systematic review and meta-analysis. PloS one, 15(12), p. e0244630.
[46] World Bank (2008). Sustainable Land Management Project, Project Appraisal Document (PAD), Ethiopia/Report No 42927-ET, Project I. D P107139.
[47] Zimmerer, K. S., Cordova-Aguilar, H., Olmo, R. M., Olivencia, Y. J. and Vanek, S. J., 2018. Mountain ecology, remoteness, and the rise of agrobiodiversity: Tracing the geographic spaces of human–environment knowledge. In Mountains: Physical, Human-Environmental, and Sociocultural Dynamics (pp. 204-218). Routledge.
[48] Zhou, C., Qian, J., Yin, Z., & Xiong, H. (2023). Suffusion in gap-graded granular soils subjected to strain-controlled cyclic loading with coupled CFD-DEM method. Transportation Geotechnics, 42, 101098.
[49] Gupta, V. P. (2020) ‘Role of agroforestry in soil conservation and soil health management: A review’, Journal of Pharmacognosy and Phytochemistry, 9(4), pp. 555–558. Available at: www.phytojournal.com
[50] Zhao, J. et al. (2017) Aggregate stability and size distribution of red soils under different land uses integrally regulated by soil organic matter, and iron and aluminum oxides, Soil and Tillage Research. Available at:
[51] Belayne. et al. (2019) ‘An assessment of the global impact of 21st century land use change on soil erosion’, American Journal of Modern Energy, 8(1), pp. 27–39. Available at:
[52] Bowles, C. (1999). An investigation into the flow structure of a generalised open channel intake. Nottingham Trent University (United Kingdom).
Cite This Article
  • APA Style

    Jawi, T. G. (2024). Effect of Chomo Grass (Brachiariahumidicola) and Vetiver Grass (Vetiveriazizanioides) on Selected Soil Properties in Mana Sibu District, Western Ethiopia. Frontiers, 4(4), 167-178. https://doi.org/10.11648/j.frontiers.20240404.17

    Copy | Download

    ACS Style

    Jawi, T. G. Effect of Chomo Grass (Brachiariahumidicola) and Vetiver Grass (Vetiveriazizanioides) on Selected Soil Properties in Mana Sibu District, Western Ethiopia. Frontiers. 2024, 4(4), 167-178. doi: 10.11648/j.frontiers.20240404.17

    Copy | Download

    AMA Style

    Jawi TG. Effect of Chomo Grass (Brachiariahumidicola) and Vetiver Grass (Vetiveriazizanioides) on Selected Soil Properties in Mana Sibu District, Western Ethiopia. Frontiers. 2024;4(4):167-178. doi: 10.11648/j.frontiers.20240404.17

    Copy | Download

  • @article{10.11648/j.frontiers.20240404.17,
      author = {Tola Geleta Jawi},
      title = {Effect of Chomo Grass (Brachiariahumidicola) and Vetiver Grass (Vetiveriazizanioides) on Selected Soil Properties in Mana Sibu District, Western Ethiopia
    },
      journal = {Frontiers},
      volume = {4},
      number = {4},
      pages = {167-178},
      doi = {10.11648/j.frontiers.20240404.17},
      url = {https://doi.org/10.11648/j.frontiers.20240404.17},
      eprint = {https://article.sciencepublishinggroup.com/pdf/10.11648.j.frontiers.20240404.17},
      abstract = {Biological SWC practices of chomo grass, vetiver grass are the most productive, easy to accept and effective at reducing soil erosion and increasing soil organic matter. The objective of this research was to evaluate their effect on some selected soil physicochemical properties in Mana Sibu area. The land treated with chomo grass, vetiver grass, and adjacent untreated lands, as well as the three age groups of these grasses, young (0-10), middle (10-20), and old (20-30) years were considered. A total of 27 soil samples were collected from the subsurface of 0–20 cm soil depth in a 'zigzag' design because of vetiver strips impractical for means. The gathered soil samples were evaluated using laboratory procedures, and the general linear model included a total of 8 variables. The dry sieving analysis was carried out to separate the soil aggregate stability. Chomo and vetiver grasses effect on soil physicochemical properties, the clay soil texture was statistically highly significant at p  2 mm, 0.075-0.425 mm, and 0.075 mm. Results for SOC were statistically significant at p< 0.05, while TN was at p < 0.05, soil PH at P < 0.01, and CEC at p <0.01.
    },
     year = {2024}
    }
    

    Copy | Download

  • TY  - JOUR
    T1  - Effect of Chomo Grass (Brachiariahumidicola) and Vetiver Grass (Vetiveriazizanioides) on Selected Soil Properties in Mana Sibu District, Western Ethiopia
    
    AU  - Tola Geleta Jawi
    Y1  - 2024/12/30
    PY  - 2024
    N1  - https://doi.org/10.11648/j.frontiers.20240404.17
    DO  - 10.11648/j.frontiers.20240404.17
    T2  - Frontiers
    JF  - Frontiers
    JO  - Frontiers
    SP  - 167
    EP  - 178
    PB  - Science Publishing Group
    SN  - 2994-7197
    UR  - https://doi.org/10.11648/j.frontiers.20240404.17
    AB  - Biological SWC practices of chomo grass, vetiver grass are the most productive, easy to accept and effective at reducing soil erosion and increasing soil organic matter. The objective of this research was to evaluate their effect on some selected soil physicochemical properties in Mana Sibu area. The land treated with chomo grass, vetiver grass, and adjacent untreated lands, as well as the three age groups of these grasses, young (0-10), middle (10-20), and old (20-30) years were considered. A total of 27 soil samples were collected from the subsurface of 0–20 cm soil depth in a 'zigzag' design because of vetiver strips impractical for means. The gathered soil samples were evaluated using laboratory procedures, and the general linear model included a total of 8 variables. The dry sieving analysis was carried out to separate the soil aggregate stability. Chomo and vetiver grasses effect on soil physicochemical properties, the clay soil texture was statistically highly significant at p  2 mm, 0.075-0.425 mm, and 0.075 mm. Results for SOC were statistically significant at p< 0.05, while TN was at p < 0.05, soil PH at P < 0.01, and CEC at p <0.01.
    
    VL  - 4
    IS  - 4
    ER  - 

    Copy | Download

Author Information